End-to-End ELT Pipeline for a Video Streaming Platform
Table of Contents Link to heading
- System Architecture
- Project Overview
- Data Sources
- Data Modeling and Storage Strategy
- ELT Pipeline and Orchestration
- Analytics Dashboard
- How to Replicate this Project
- Tools and Technologies
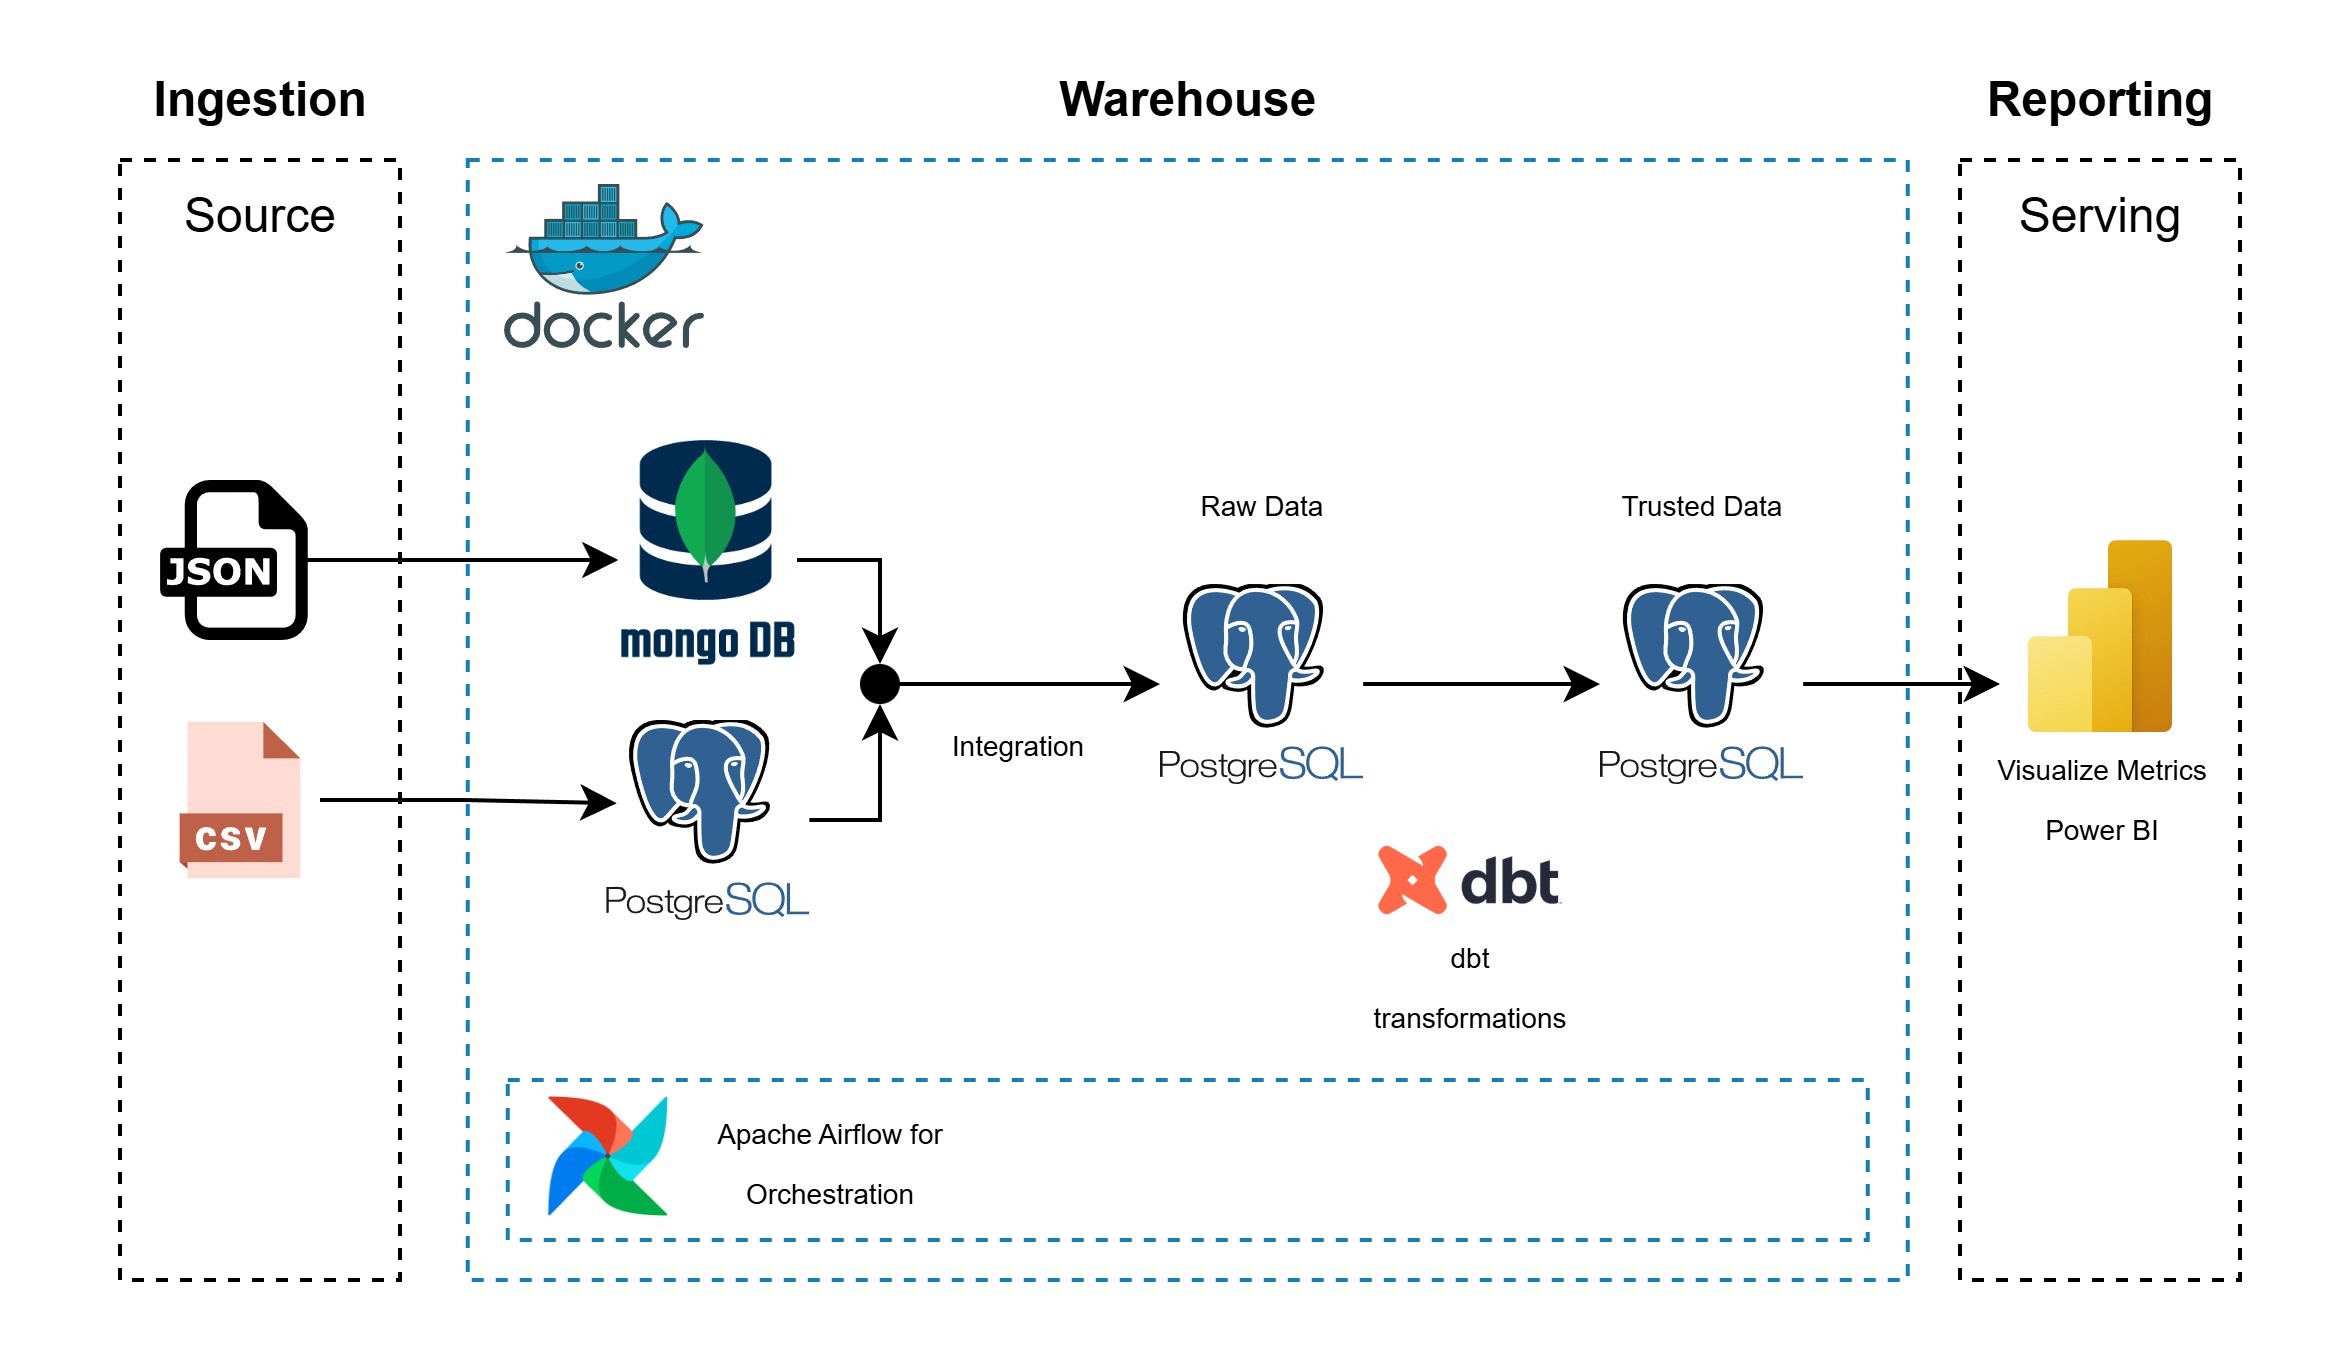
System Architecture Link to heading
You can find the code for this project in GitHub. Link to heading
Project Overview Link to heading
This project implements an end-to-end ELT pipeline designed to analyze the performance of a video streaming platform using synthetic data. The pipeline simulates real-world platform behavior through datasets representing users, content, and viewing sessions.
The primary objective is to demonstrate the design and implementation of a modern data engineering workflow, including:
- Data ingestion from heterogeneous sources
- Integration of relational and NoSQL data models
- Centralized storage in a data warehouse
- Transformations and dimensional modeling for analytics
The final output enables analytical reporting and dashboarding to support data-driven insights into user behavior and content performance.
Data Sources Link to heading
Three synthetic datasets were created to emulate a video streaming platform:
- users.csv
Contains user demographics and subscription details. - viewing_sessions.csv
Captures detailed viewing session information, including device type, session duration, and streaming quality. - content.json
Stores structured metadata for movies and TV series.
Data Modeling and Storage Strategy Link to heading
To reflect a realistic multi-source environment:
MongoDB (NoSQL source)
content.json
PostgreSQL (Relational source)
viewing_sessions.csvusers.csv
The ELT pipeline extracts data from both MongoDB and PostgreSQL and loads it into PostgreSQL as a Data Warehouse. The warehouse is structured using multiple schemas:
rawschema
Stores ingested data in a normalized, source-aligned format.trustedschema
Contains transformed, analytics-ready data modeled using dimensional design principles and created with dbt.
ELT Pipeline and Orchestration Link to heading
The pipeline follows an ELT approach:
Extract
Data is extracted from MongoDB and PostgreSQL source systems.Load
Raw data is loaded into the PostgreSQL Data Warehouse under therawschema.Transform
dbt is used to apply transformations, enforce data quality rules, and create a dimensional model in thetrustedschema.
The entire workflow is orchestrated using Apache Airflow, ensuring:
- Task dependency management
- Logging and observability
- Error handling and retries
- Idempotent executions
All components run in a Dockerized environment to ensure consistency and reproducibility.
DAG Overview Link to heading
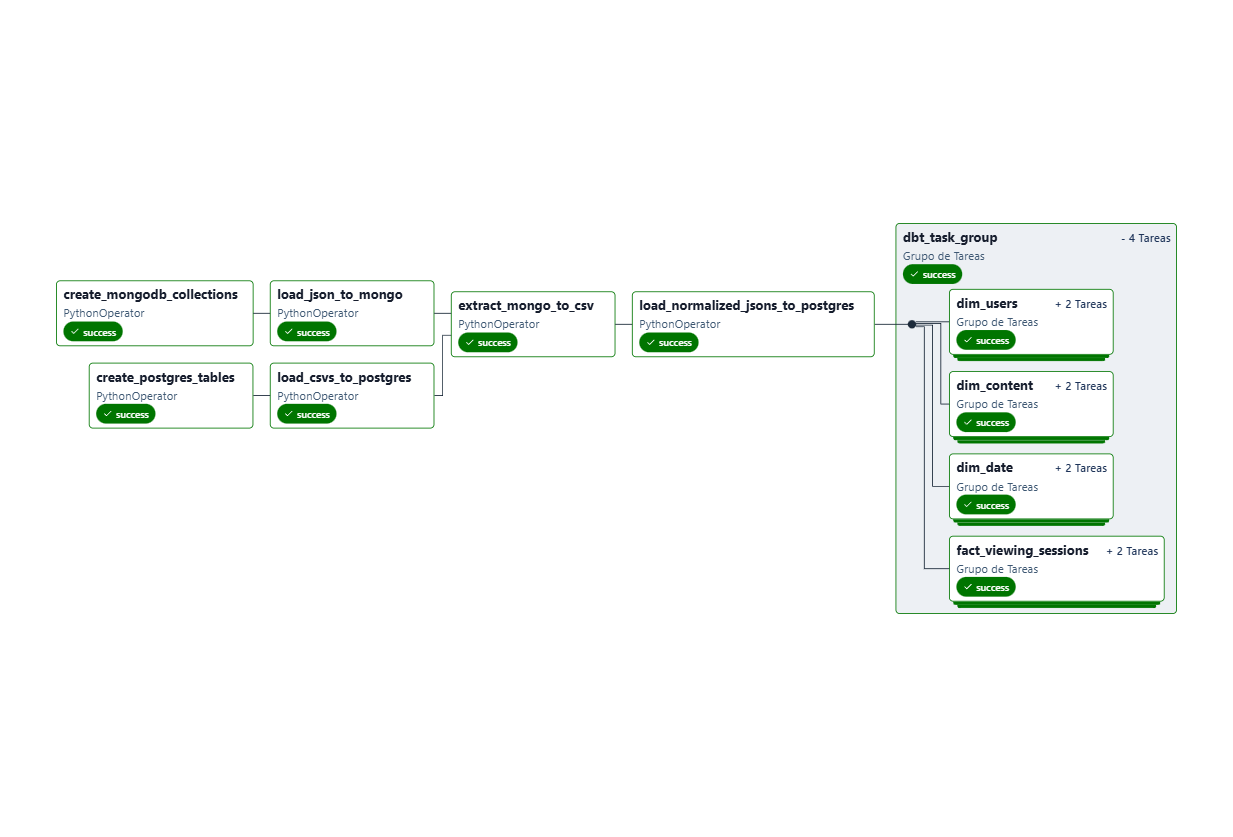
The Airflow DAG video_streaming_elt_pipeline consists of the following key tasks:
- Create MongoDB Collections: Initializes the MongoDB source database.
- Create PostgreSQL Tables: Initializes the PostgreSQL source database.
- Load JSON to MongoDB: Loads
content.jsoninto MongoDB. - Load CSVs to PostgreSQL: Loads
users.csvandviewing_sessions.csvinto PostgreSQL. - Extract to Data Warehouse: Extracts data from source systems and loads it into the
rawschema of the PostgreSQL Data Warehouse. - Transform with dbt: Executes dbt models to transform raw data into a dimensional model in the
trustedschema.
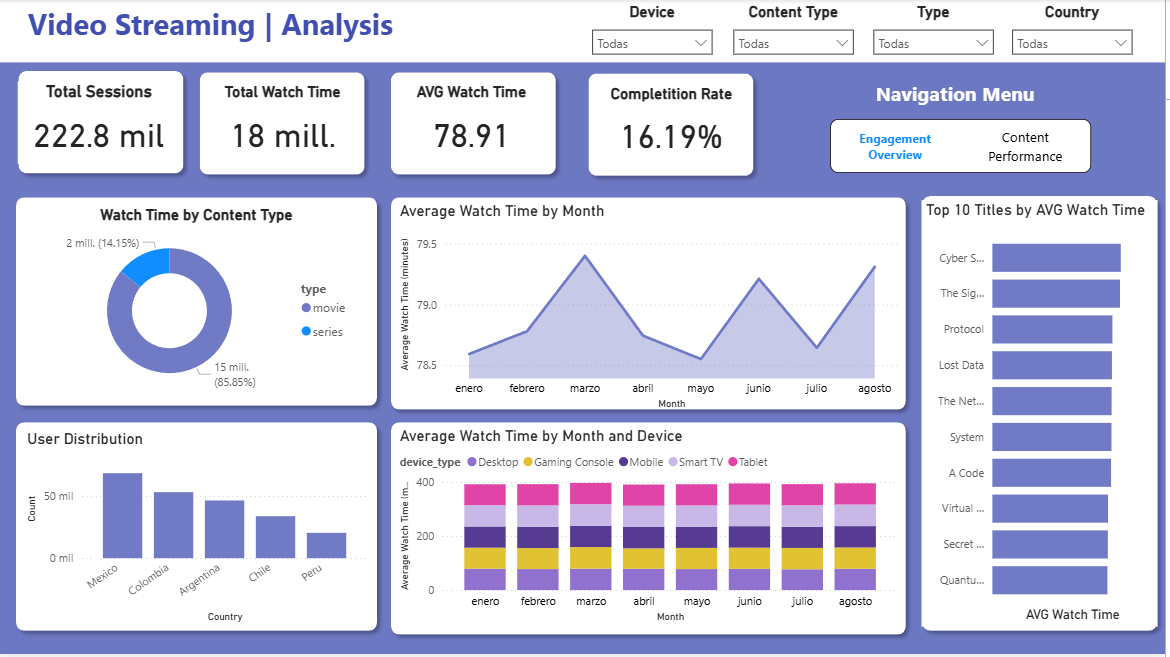
Analytics Dashboard Link to heading
First section:
Second section:
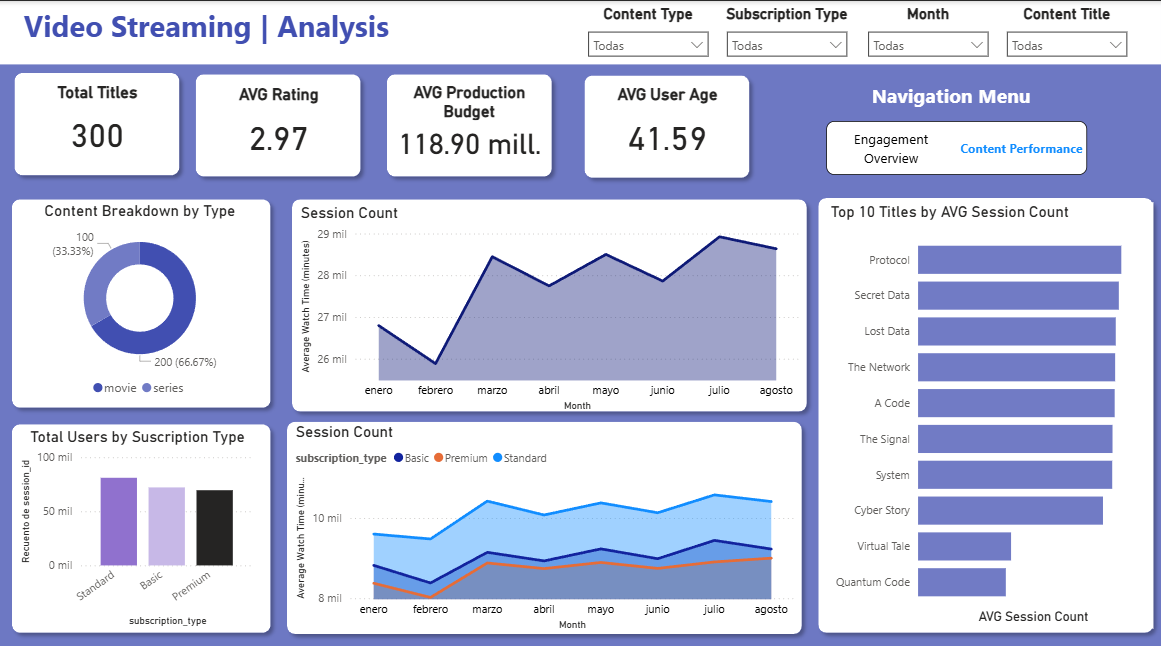
A Power BI dashboard was built on top of the dimensional model to visualize key performance indicators (KPIs), including:
- User demographics and subscription distribution
- Content popularity and engagement
- Viewing session metrics and usage patterns
The dashboard enables interactive exploration of platform performance and supports data-driven decision-making.
Tools and Technologies Link to heading
- Database: PostgreSQL, MongoDB
- Programming Language: Python
- Orchestration: Apache Airflow
- Data Transformation: dbt
- Visualization: Power BI