Sales Analytics Dashboard: Istanbul Shopping Malls
Project Overview Link to heading
This was the final project for the Visualization Modeling course. The goal was to perform a complete analysis of a dataset based on business questions and create a dashboard that displays the insights in a clear and concise way. It was decided to use Python for data cleaning and Power BI for data visualization. The dataset contains information about shopping transactions from 10 distinct shopping malls in Istanbul from 2021 to 2023, it is important to mention that both years, 2021 and 2022 are complete, while 2023 is incomplete, only the first two months are available.
Dashboard Overview Link to heading
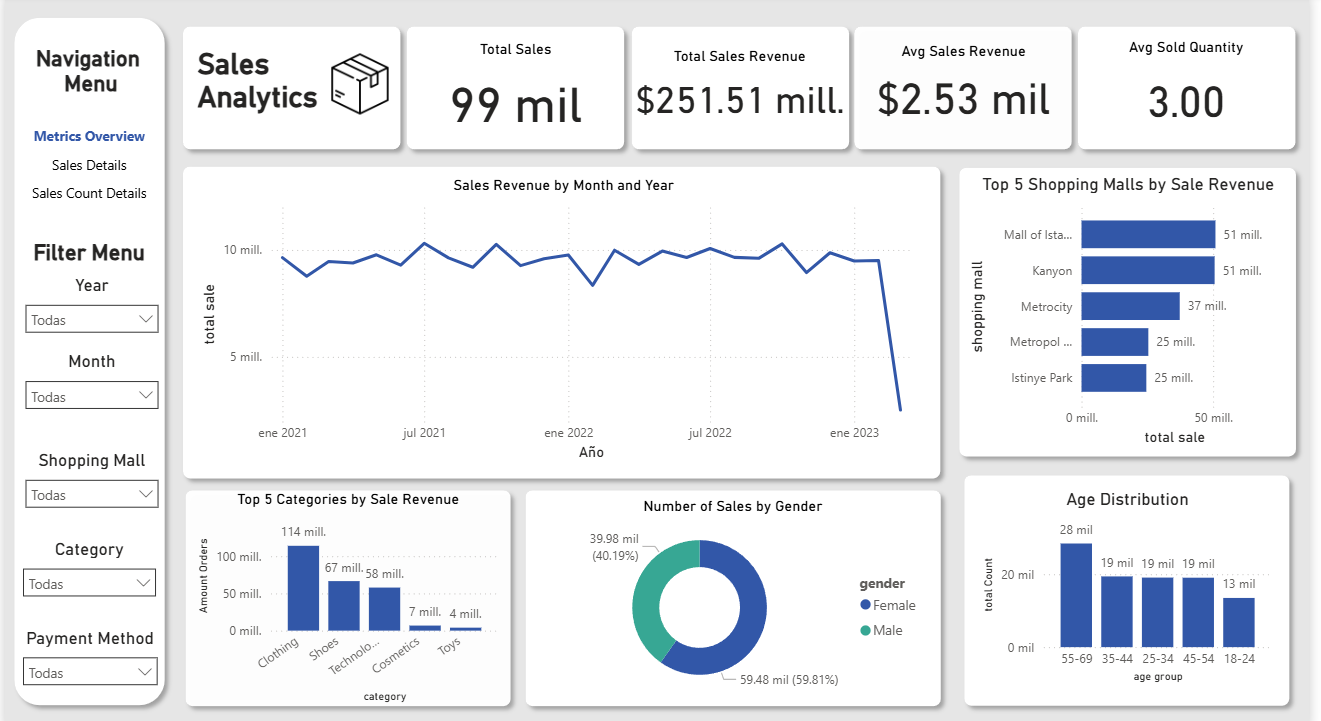
Section 1: Metrics Overview
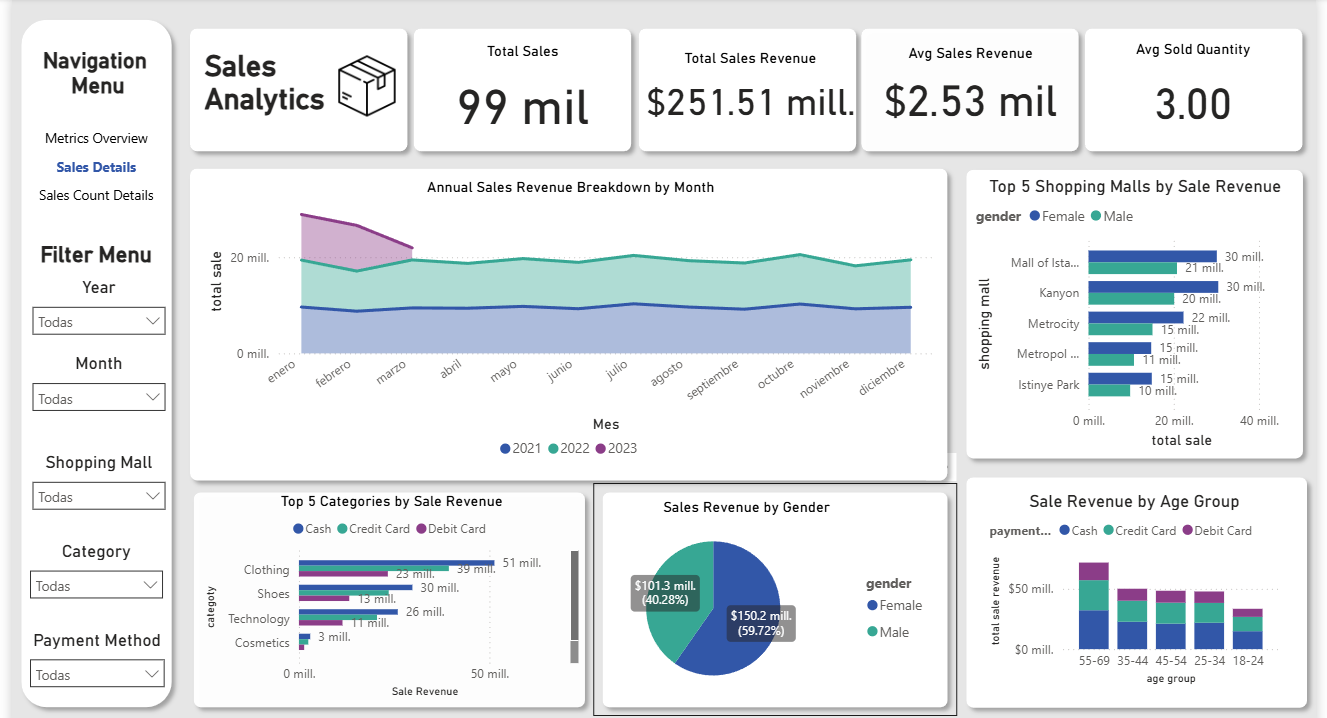
Section 2: Sales Details
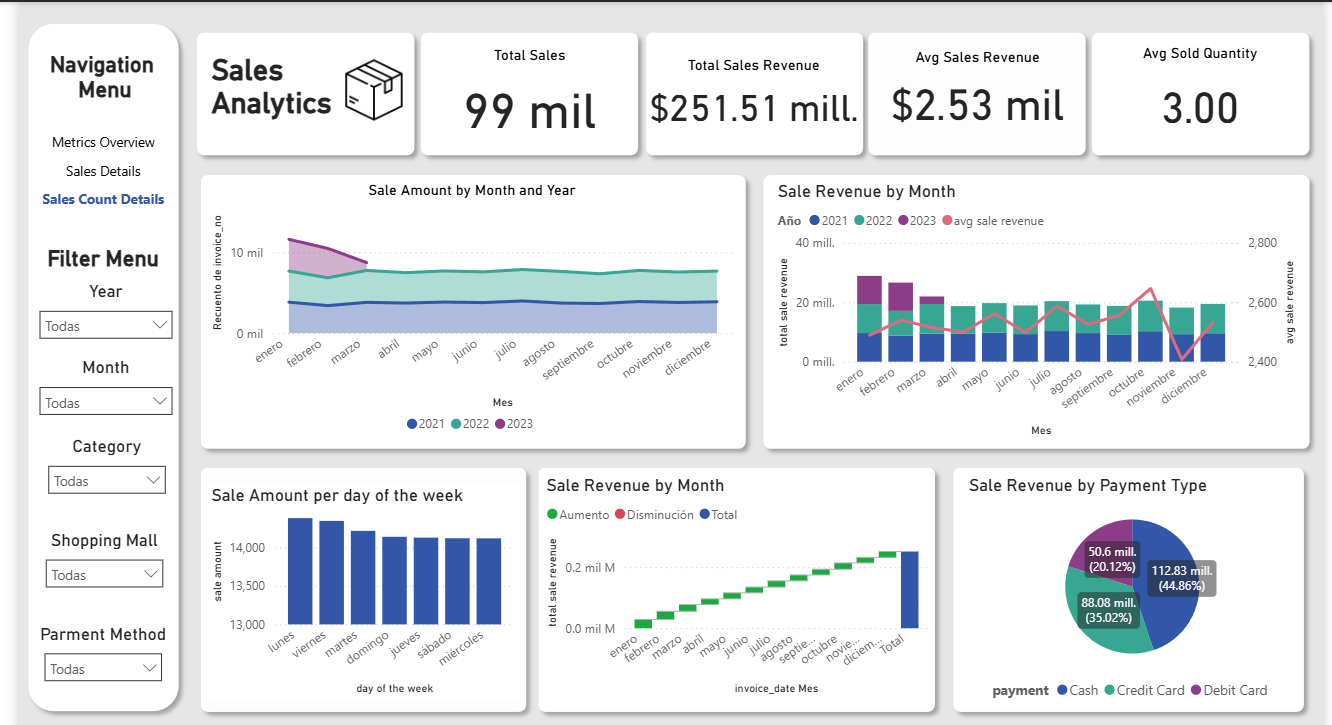
Section 3: Sales Count Details
Data Source Link to heading
The data was sourced from Kaggle and encompasses shopping transactions from 10 distinct shopping malls in Istanbul, covering a three-year period from 2021 to 2023. It comprises 99,457 rows and 10 columns, all of which are utilized for analysis. It provides a comprehensive view of shopping habits in Istanbul by including details on customer demographics, product purchases, payment methods, and shopping mall locations.
If you would like to download the dataset, you can find it here.
Purpose and Main User Link to heading
The Sales Analytics Dashboard was specifically created to empower executive stakeholders with actionable insights derived from the comprehensive shopping transaction data. It serves as a central hub for understanding sales performance and customer behavior.
Dashboard Components Link to heading
Menu Navigation Link to heading
The navigation menu on the left side of the dashboard allows users to seamlessly switch between different sections, providing an organized and intuitive way to explore various aspects of the sales data.
Filter Panel Link to heading
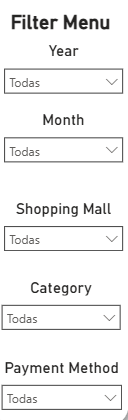
The filter panel provides robust filtering capabilities, enabling users to refine the displayed data based on various criteria. You can segment the data by category, year, month, shopping mall, and payment method, allowing for highly specific analysis.
Main Metrics Link to heading
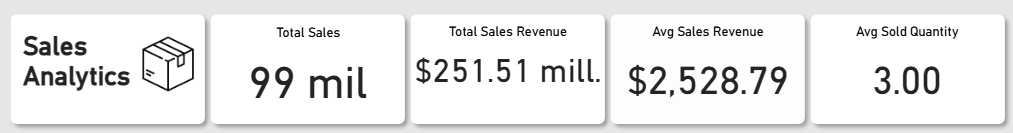
This section features prominent cards that display key performance indicators (KPIs) at a glance. These include the total sales amount, total sales revenue, average sales revenue per transaction, and average quantity sold, providing an immediate overview of overall sales performance.
Results of the Analysis Link to heading
The analysis of shopping transactions from ten shopping malls in Istanbul (2021–2023) reveals several relevant customer and sales patterns.
The majority of customers belong to the 55–69 age group, which also accounts for the highest total spending, indicating that this segment has strong purchasing power and high engagement.
In terms of gender distribution, female customers represent 59.72% of total transactions, making them the dominant customer segment across the dataset.
The top five product categories by sales volume are clothing, shoes, technology, cosmetics, and toys, with clothing leading overall consumption. This highlights a strong demand for fashion-related products across all malls.
Regarding payment methods, cash is the most frequently used payment type, followed by credit cards and debit cards, suggesting a continued preference for traditional payment methods despite the availability of electronic options.
From a temporal perspective, Mondays register the highest number of transactions, indicating increased consumer activity at the start of the week.
Finally, sales revenue remains relatively stable across the three-year period, with no significant year-over-year growth or decline. This suggests consistent performance but limited organic growth during the analyzed timeframe.
Technologies Used Link to heading
- Python
- Power BI